Resources
Specialized Instrumentation for studying subcellular drug transport
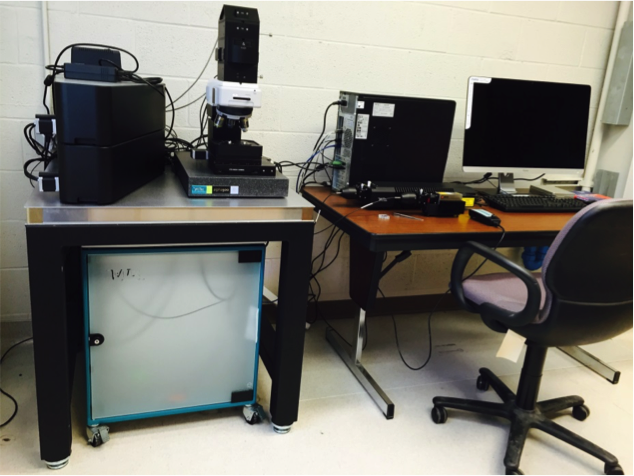
- Chemical Imaging Microscope (Witec AlphaA300R chemical imaging system; housed in the PI’s Subcellular Drug Transport Laboratory at the College of Pharmacy)
 The WitecAlpha300R confocal microscope couples a highly sensitive Raman spectrometer to a standard optical microscope, allowing image-based chemical imaging of samples, with nanometer level resolution. Without relying on any fixation or other invasive sample processing steps, Raman confocal microscopy facilitates acquisition of high magnification, two (or three) dimensional confocal Raman spectral images from unfixed, unstained, wet or dry samples. These Raman spectral images corresponds to the pixel-by-pixel map of the vibrations of chemical bonds present in a biological sample, at 200 nanometer resolution in the x,y plane and 500-1000 nanometer resolution in the Z axis. For increased scanning speed (as may be used to monitor changes in particle size and shape occurring upon particle dissolution or to follow the kinetics of distribution of a small molecule drug inside cells), spectral data acquisition can be restricted to specific region or line on a microscopic field of view, or can be limited to a specific peak wavelength in which a molecule of interest (a drug or excipient molecule) shows the vibrations of interest. Following image acquisition, image analysis software can be used to map the spectrum for each pixel in an image of a microscopic specimen, which can then be used for measuring the distribution of different molecular components in the microscope field of view. Furthermore, rapid image data acquisition allows monitoring and measuring molecular transport phenomena and other chemical kinetic processes, over time.In essence, the Raman spectrum of a molecule can be thought as an electromagnetic signature reflecting the natural vibrations of the chemical bonds that make up the molecule. When used as an analytical technique, Raman spectra can reveal the presence of specific molecules in a sample, based on characteristic wavelength-dependent differences in the intensity of scattered laser light. In solids, interaction of molecules with other neighboring molecules can impose constraints in the manner in which chemical bonds vibrate in a molecule.
Related publications:
- Baik J; Rosania GR (2011) Molecular imaging of intracellular drug-membrane aggregate formation. Molecular Pharmaceutics Oct 3;8(5):1742-9.PMCID: PMC3185106
- Keswani, R; Baik, J; Yeomans, L; Hitzman, C; Pawate, A; Kenis, P; Rodríguez-Hornedo, N; Stringer, KA; Rosania, GR (2015) "Chemical Analysis of Drug Biocrystals: A Role for Counterion Transport Pathways in Intracellular Drug Disposition" Molecular Pharmaceutics. DOI: 10.1021/acs.molpharmaceut.5b00032
- Quantitative Polarization/Fluorescence/Absorbance Multiparameter Microscope (LC Pol-Scope Imaging System housed in the PI’s Subcellular Drug Transport Laboratory at the College of Pharmacy)
 This comprehensive microscope suite is a custom-designed assembly for color brightfield, absorbance, epifluorescence and quantitative polarization microscopy for performing biregringence and dichroism measurements on crystalline, intracellular drug inclusions. The primary unit is a Nikon Eclipse Ti attached with 5 objective lenses (from 5x to 100x with an additional optical magnification of 1.5x) and 3 cameras – Nikon DS Fi2 for color image acquisition, Photometrics CoolSNAP MYO for epifluorescence microscopy and absorbance analysis & CRi Abrio for polarization microscopy. The system is controlled with proprietary software Nikon NIS-Elements for color and epifluorescence microscopy. 4-color fluorescence microscopy can be performed via the use of filters at wavelengths – 1) Excitation-405 nm, Emission-450 nm (DAPI), 2) Excitation-490 nm, Emission-510 nm (FITC), 3) Excitation-590 nm, Emission-610 nm (Texas Red) and 4) Excitation-650 nm, Emission-670 nm (Cy5). Polarization microscopy is performed with an LCPolScope Plugin, as part of Micromanager (Vale Laboratory, UCSF) to measure either birefringence or diattenuation anisotropy (dichroism). This setup utilizes a computer controlled liquid crystal (LC) compensator capable of generating linearly polarized light in any orientation coupled with a polarization analyzer (only for birefringence). Illuminating light is narrowed to 546 nm or 623 nm by the interference filter, and the light is linearly polarized by passing it through a universal compensator. The subsequent image maps of diattenuation, mean transmittance, and angle of high transmittance are generated by image analysis algorithms. Thus, this state-of-the-art set-up allows for the acquisition of polarization, brightfield and fluorescence images of the same sample at the same field of illumination allowing for a comprehensive analysis (chemical/cellular/kinetic) of intracellular drug crystals and aggregates. For example, structural features of drug crystals or aggregates can be combined with their cellular and biochemical signatures using immunofluorescence or immunohistochemistry. Finally, a micromanipulator with a pneumatic valve system is also coupled to this setup to probe single cells with physical perturbations
Related publications:
Min KA, Rajeswaran WG, Oldenbourg R, Harris G, Keswani R, Chiang M, Talattof A, Hafeez M, Horobin RW, Larsen SD, Stringer KA, and Rosania GR. (2015) “Massive Bioaccumulation and Self-Assembly of Phenazine Compounds in Live Cells” Advanced Science. DOI: 10.1002/advs.201500025.
- Stimulated Imaging Mass Spectrometry Microscope (Cameca NanoSIMS housed at Stanford University Nanoshared Facilities)
 The Cameca NanoSIMS instrument allows for the quantitative analysis of the ratio of different isotopes of different elements, as are present within intracellular drug inclusions. To study freeze-dried, cryosectioned tissue samples, the instrument focuses a nanometer-wide beam of Beryllium atoms of the surface of the sample. The molecules exposed to the beam of atoms on the surface of the sample become ionized and break apart into their atomic components. The ionized atoms are then directed into a mass spectrometry detector, where the counts of six different isotopes of specific molecular masses are simultaneoulsly monitored by highly sensitive detectors. Based on reference datasets acquired from pure drug crystals, the ratio of different isotopes allows determining whether the molecules in the crystals are present in pure form, as well as establishing the type of counterions or other contaminants that may be present in drug salts. In addition, the detectors can be used to sense specific isotope labels like C14 or deuterium, to track the location of labeled molecules in a sample.
Related publications:
Keswani, R; Baik, J; Yeomans, L; Hitzman, C; Pawate, A; Kenis, P; Rodríguez-Hornedo, N; Stringer, KA; Rosania, GR (2015) "Chemical Analysis of Drug Biocrystals: A Role for Counterion Transport Pathways in Intracellular Drug Disposition" Molecular Pharmaceutics. DOI: 10.1021/acs.molpharmaceut.5b00032
- High Throughput Cytometers. (Beckman Coulter MoFlo Astrios Cell Sorter housed at the Comprehensive Cancer Center Flow Cytometry Core and the Amnis® ImageStreamX Mark II) – housed at the Comprehensive Cancer Center Flow Cytometry Core
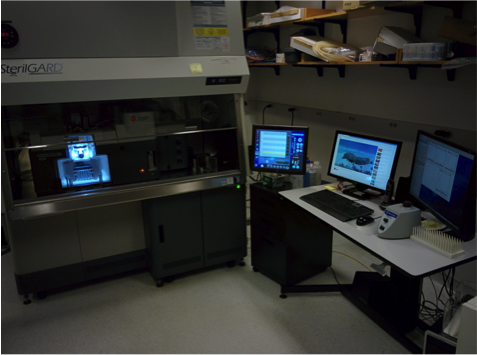
 The MoFlo Astrios Flow Cytometer is a conventional cell sorter with advanced fluidics for efficient high-throughput, high efficiency cell sorting. It is housed with 6 lasers with excitation filter sets (355 nm, 405 nm, 488 nm, 532 nm, 561 nm, 642 nm) and capable of collecting 32 simultaneous parameters. The fluidics are capable of handling sheath pressures from 4-100 psi, can automatically agitate the samples, has a bubble detector and is computer controlled for automatic sample start, stop and backflush. The machine has a removable sorting chamber where up to 4 sorted populations can be acquired simultaneously. Sorting purity of >99% can be achieved at 70,000 EPS, 70 μm nozzle at 60 psi and a starting population of 1% positive events with >90% yield. Both forward scatter and side scatter in log, height, area, width, log area signals with compensation can be acquired at all the wavelengths ≥405 nm. Data analysis can be performed via FlowJo software either at the facility itself or at the Rosania Lab. This machine is an established workhorse for analyzing cellular level details with high throughput, especially in the context of analyzing cells with drug aggregates and crystals followed by sorting them via positive events and continuing biochemical analysis with precision. This facility is available to trained users on a walk-in basis or by scheduling time with a technician in advance.
 In addition, the Amnis® ImageStreamX Mark II imaging flow cytometer combines the speed, sensitivity, and phenotyping abilities of flow cytometry with the detailed imagery and functional insights of microscopy enabling a broad range of applications. The Mark II produces multiple high resolution images of every cell directly in flow, including brightfield, darkfield (SSC) and up to 10 fluorescent markers with sensitivity exceeding conventional flow cytometers for rare cell applications. For our studies, image cytometry is a valuable tools to quantify and monitor the bioaccumulation and subsequent phenotypic changes due to the presence of fluorescent intracellular drug aggregates such as those formed by clofazimine in macrophages.
Related publications:
- Keswani RK, Yoon GS, Sud S, Stringer KA, Rosania GR (2015) A Far-Red Fluorescent Probe for Flow Cytometry and Image-Based Functional Studies of Xenobiotic Sequestering Macrophages. Cytometry A. doi: 10.1002/cyto.a.22706
- Yoon GS, Sud S, Keswani RK, Baik J, Standiford TJ, Stringer KA, and Rosania GR(2015) Phagocytosed Clofazimine Biocrystals can Modulate Innate Immune Signaling by Inhibiting TNFα and Boosting IL-1RA Secretion. Molecular Pharmaceutics. DOI: 10.1021/acs.molpharmaceut.5b00035
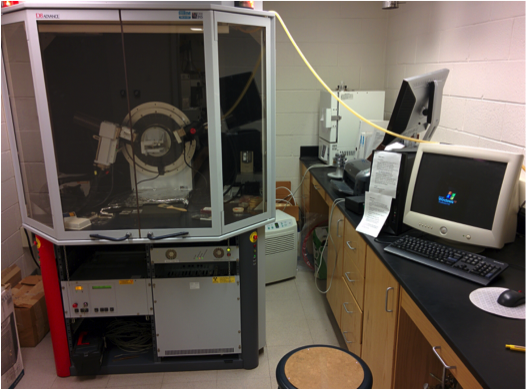
- Powder X-ray Diffraction and Single Crystal X-ray diffraction.
 (Rigaku R-Axis Spider powder X-ray diffractometer housed in the Department of Chemistry, adjacent to the College of Pharmacy). This machine is equipped with a Cu Kα source and an image plate area detector which enables the use of microgram sample sizes due to the higher sensitivity of detection when compared to a CCD detector. In addition, the X‐ray beam is collimated with variable spot size (0.3, 0.5, and 0.8 mm) allowing the beam to be adjusted to match a specific sample. Another feature of the R‐Axis spider is the use of a ¼ χ goniometer which can be oscillated in ω, χ, and φ to produce powder patterns with minimized preferred orientation and provides a more accurate identification of a crystalline phase. The R‐Axis Spider is equipped with an Oxford Instruments Cryostream Plus capable of temperatures in the range of 80 – 500 K and is ideal for solid‐state phase transitions and decomposition studies. This machine can also acquire data on samples in capillaries for microdiffraction, thus enabling the study of low amount of sample (μg) critical for samples that have been acquired from biological tissues or for expensive chemical derivatives. This facility is available to trained users on a walk-in basis or by scheduling time in advance.
Related Publications:
Keswani, R; Baik, J; Yeomans, L; Hitzman, C; Pawate, A; Kenis, P; Rodríguez-Hornedo, N; Stringer, KA; Rosania, GR (2015) "Chemical Analysis of Drug Biocrystals: A Role for Counterion Transport Pathways in Intracellular Drug Disposition" Molecular Pharmaceutics. DOI: 10.1021/acs.molpharmaceut.5b00032
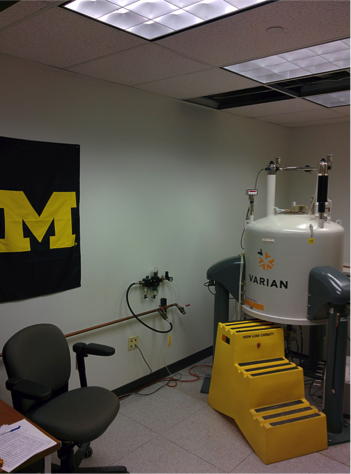
- Nuclear Magnetic Resonance Spectrometers

 (Varian 400 MHz MR NMR and Varian 500 MHz VNMRS housed at the NMR Core at the University of Michigan College of Pharmacy).VNMRS housed at the NMR Core at the University of Michigan College of Pharmacy). Both instruments have pulse field gradients, autotune and autoshim features and a 5mm ONEprobe with multinuclear capabilities, allowing the observation of most NMR active nuclei (e.g. 1H, 11B, 13C, 15N, 19F, 29Si, 31P, etc.) Commonly performed experiments include the acquisition of simple 1D spectra, solvent suppression, as well as two-dimensional (2D) homonuclear COSY, NOESY, and heteronuclear HSQC and HMBC experiments. The 400 MHz is operated by host software VNMRJ 3.2. The 500 MHz NMR is operated by host software VNMRJ 4.0 is also equipped with a 7510-AS auto sampler system with 12 locations for automatic multiple sample running. In addition to the 5mm ONEprobe, the 500 also has a 3mm ONE probe. The facility also has two workstation computers with MestreNova 9.0 (MestreLab Spain) for data processing. With this equipment, analysis of drug crystals, intracellular aggregates or chemical synthesis can be done with high reliability. Dr. Larisa Yeomans, the NMR core’s full-time NMR specialist, has experience in maintaining the instruments, user training, and running complex spectra, and is available during normal business hours to assist with acquisition.
Related Publications:
Keswani, R; Baik, J; Yeomans, L; Hitzman, C; Pawate, A; Kenis, P; Rodríguez-Hornedo, N; Stringer, KA; Rosania, GR (2015) "Chemical Analysis of Drug Biocrystals: A Role for Counterion Transport Pathways in Intracellular Drug Disposition" Molecular Pharmaceutics. DOI: 10.1021/acs.molpharmaceut.5b00032
Our project team has access to all the Resources and Core Facilities at the University of Michigan:
Resources:
- The University of Michigan College of Pharmacy
- The University of Michigan School of Medicine
- The University of Michigan Cancer Center
- The Center for the Discovery of New Medicines
- Guide to Drug Discoveries at Michigan
Core Facilities:
- Center for Chemical Genomics
- Center for Structural Biology
- Vahlteich Medicinal Chemisty Core Core (VMCC)
- Pharmacokinetics Core
- Biomedical Mass Spectrometry Facility
- Small Animal Imaging Resource (Cancer)
- Physiology Phenotyping Core (Cardiovascular)
- Nutritional Obesity Center
- Michigan Regional Comprehensive Metabolomics Research Core
- Biochemical Nuclear Magnetic Resonance Core


